40+ Email Marketing Statistics For 2024: Usage, Facts & Trends
Who was it that said email is dead? Whoever they were, they were wrong. Email marketing is still very much alive and kicking, and as relevant to your marketing goals as ever – and we have the statistics to prove it.
We’ve put together 40+ email marketing statistics that show you the state of email right now (spoiler: it’s still one of the most effective marketing channels around) and highlight some important trends that marketers need to know about.
The insights you can extract from the data below will tell more about the ways in which email marketing is changing, and how you need to change with it.
Editor’s picks
- The average email open rate is 17.8%. (Campaign Monitor)
- The average email click-through rate is 2.65%. (Campaign Monitor)
- Email is 40x more effective than social media for customer acquisition. (McKinsey)
Email marketing statistics & benchmarks
Let’s start by looking at the latest industry benchmarks uncovered in Campaign Monitor’s most recent email marketing report. These benchmarks are useful to measure your own performance against.
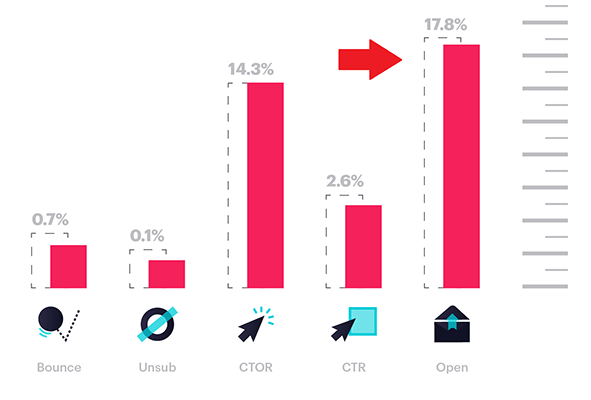
The average email open rate is 17.8%
That’s the average open rate across all industries and is based on data gathered from over 30 billion emails sent throughout 2019. Are you performing under or above average? (Campaign Monitor)
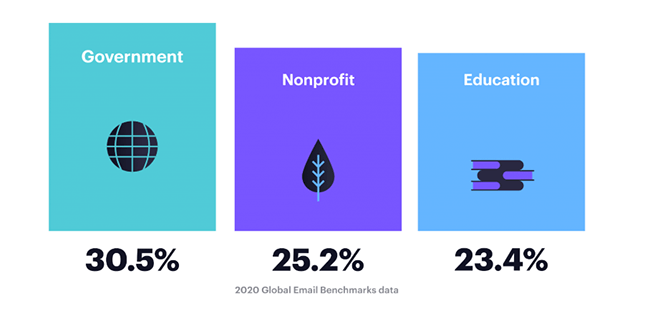
Government organizations have the highest open rates (30.5%)
Government organizations dominate when it comes to open rates. Interestingly, this figure represents an increase of more than 10% from last year, in which the average was 19.79%. (Campaign Monitor)
Automotive and aerospace have the lowest open rates (12.6%)
On the other end of the spectrum, we have the automotive and aerospace industry. They saw one of the biggest drops in open rates from last year, falling from around 17% to 12.6%. (Campaign Monitor)
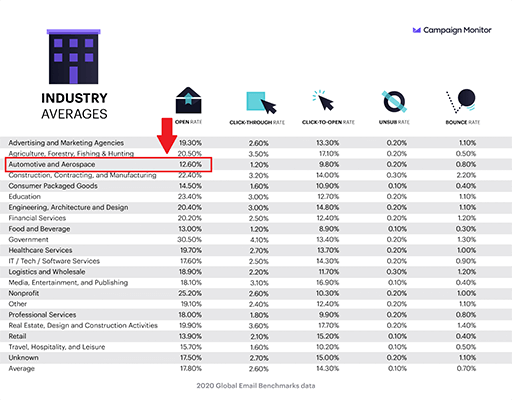
Retail only has a 13.9% average open rate
Interestingly, retail also sits at the bottom end of the table, dropping from an average open rate of 15.2% to 13.9% this year. This represents the high level of competition in the eCommerce and retail space, which impacts email open rates.
It’s not all bad news though – retail businesses also generate high email engagement and excel at driving consumer action.
This makes a strong argument for focusing more on CRO and creating high-converting emails if you’re a retailer in order to make the most of the customers that do open your emails. (Campaign Monitor)
The average email click-through rate is 2.65%
Again, that’s the average across industries and again, Government agencies were the top performers, with a 4.1% average CTR. (Campaign Monitor)
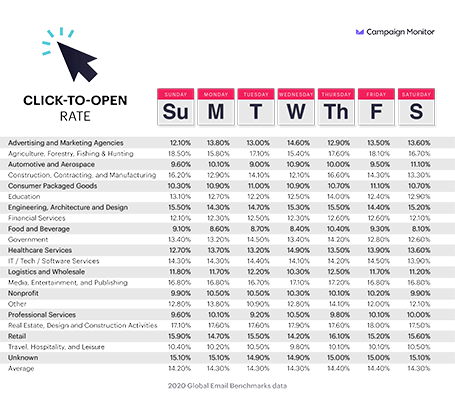
The average click-to-open rate is around 14%
14.3%, to be exact. In case you didn’t already know, the click-to-open rate is the percentage of people who have opened your email that go on to click a link or image within it. It’s arguably a better measure of how well your email copy/content is performing that CTR.
The image below shows how this average breaks down across industries. (Campaign Monitor)
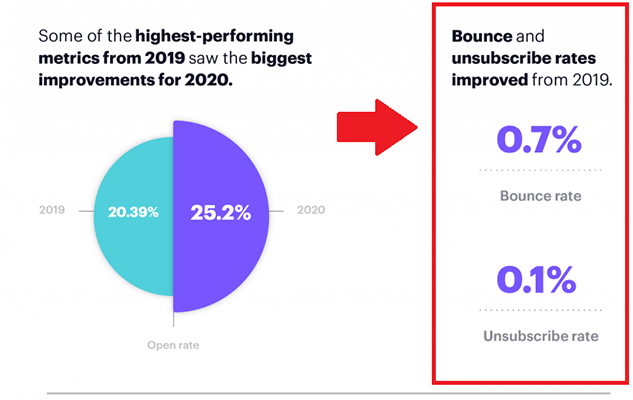
Both bounce (0.7%) and unsubscribe rates (0.1%) are on the rise
Average bounce rates (the percentage of recipients who don’t receive your email) and unsubscribe (the percentage of a mailing list that unsubscribe from communications) both improved compared to last year.
This shows us that marketers are getting better at keeping their lists clean and improving deliverability. (Campaign Monitor)
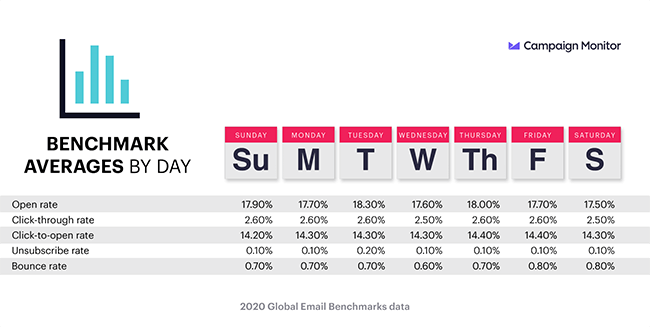
Tuesdays have the highest open (18.3%) AND unsubscribe (0.2%) rates
Take this statistic with a pinch of salt though, as the differences are very small and almost insignificant. Don’t get too hung up on chasing the ‘best day’ and focus on creating effective email campaigns. (Campaign Monitor)
Importance/relevance of email marketing
Below are some more email marketing statistics that highlight just how important email still is to marketers and businesses, and why.
Around 80% of SMBs say email is their most important customer acquisition/retention channel
Interestingly, significantly more SMB marketers voted for email than organic search, paid search, and social media. When it comes to acquiring new customers and retaining them, it looks like nothing beats email. (eMarketer)
Email is 40x more effective than social media for customer acquisition
That’s right, email is 40 times as effective as both Twitter and Facebook combined at acquiring new customers. (McKinsey)
U.S. companies spent an estimated $3.07 billion on email marketing in 2019
This is according to estimates from Statista. If accurate, that means companies increased their spending on email marketing by around a third in just 5 years. (Statista)
Email traffic converts better than both social and search traffic
4.24% of email traffic leads to purchases, whereas only 2.49% of search traffic and 0.59% of social traffic does the same. This makes sense as email subscribers are usually much further down the sales funnel and are more likely to have been through a lead nurturing process. (The American Genius)
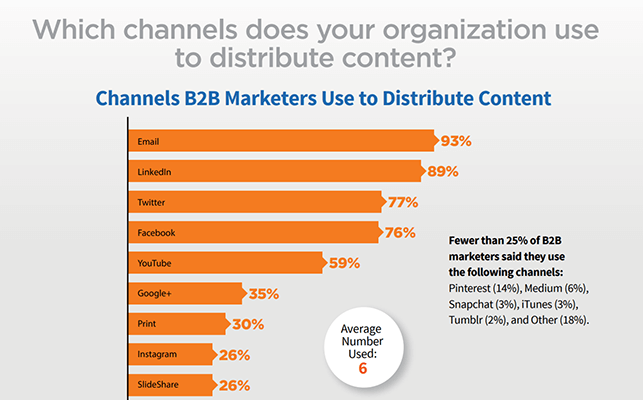
93% of marketers say email is their top content distribution channel
This is according to a 2017 report from the Content Marketing Institute. The second most popular channel used to distribute content was LinkedIn. (Content Marketing Institute)
49% of American consumers want weekly brand emails
This shows that consumers aren’t sick of receiving your promotional emails. On the contrary, they want to receive them every single week. If you’re not sending them frequently enough, you may be missing out. (Statista)
Email usage statistics
With the rise of social media and messenger apps, you’d be forgiven for assuming that email is on its way out – but that’s not necessarily the case. As the statistics below show, overall email usage is still high.
Let’s take a look at some key email usage stats:
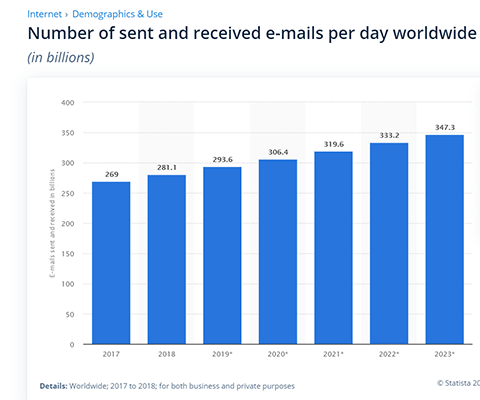
347 billion emails will be sent every day by 2023
This estimate marks a dramatic increase from the 281 billion emails that were sent back in 2018. The figure has been growing year on year and reflects the growth in the number of global email users. (Statista)
More than 50% of the global population uses email
Speaking of the growth in the number of global email users, around half of the world’s population now use email. Crazy, right? Across the world, there were 3.8 billion email users in 2018. By 2023, it’s predicted that there will be 4.4 billion. (Statista)
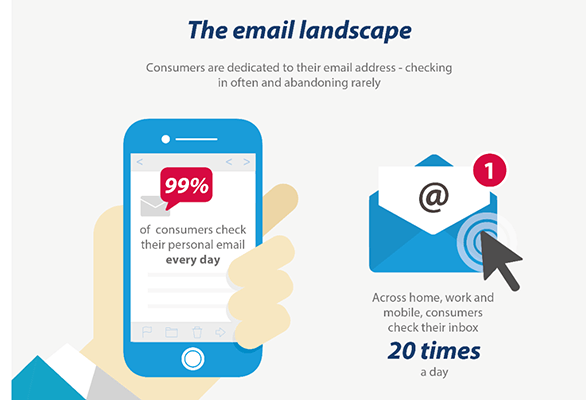
99% of consumers check their email once or more every single day
And that’s just their personal email accounts. If we factor in work and mobile inboxes, the average is actually around 20 times per day. (DMA Insights)
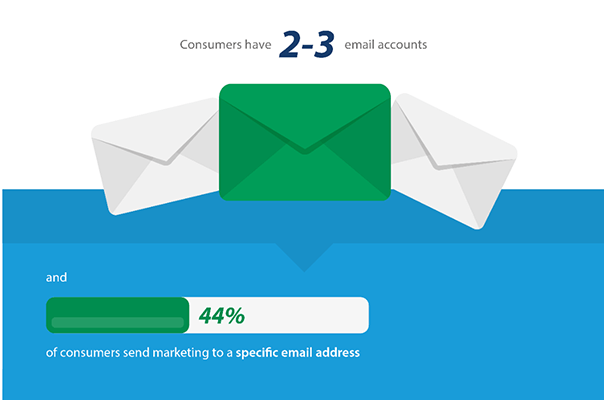
Consumers have 2-3 email accounts
But they don’t use them all in the same way. They’re much more likely to sign up to mailing lists on their personal account than they’re work account, and 44% of them actually have an email address set up exclusively for marketing messages. (DMA Insights)
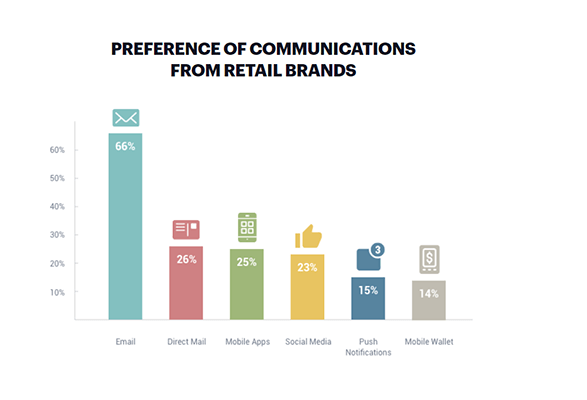
Email is the preferred way to receive brand updates
By a large margin. 66% of consumers rank email as their preferred brand communication channel, compared to just 23% that prefer social media. (Campaign Monitor)
Email marketing ROI statistics
Let’s talk money. Here are some statistics that tell you more about the ROI of email marketing campaigns.
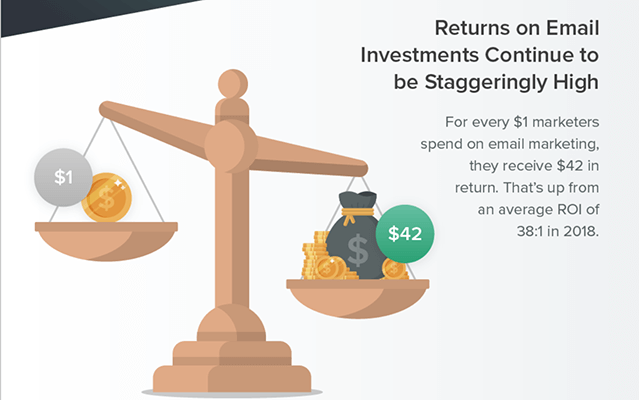
Email marketing has an average ROI of 42:1
This suggests that for every dollar you spend on your email marketing efforts, you can expect to earn $42 back, on average. Average ROIs are also up from 2018, when the ratio was 38:1. (Litmus)
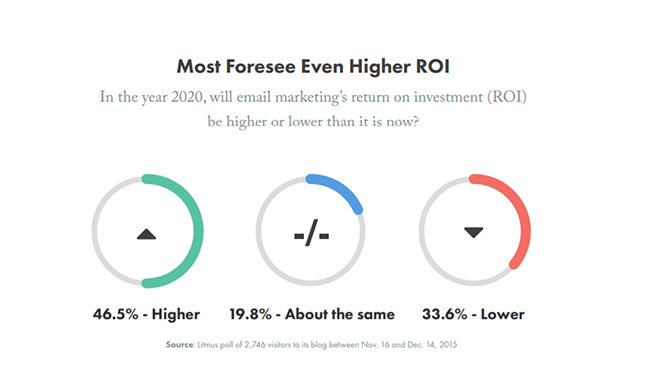
66.3% of participants in a marketing survey say email ROIs will increase
Despite the fact that email marketing ROIs are already higher than any other marketing channel, marketers are optimistic that it will continue to climb even higher. The majority of marketers also agree that it will continue to be one of the top channels in delivering ROI for at least the next 5 years, according to Litmus.com.
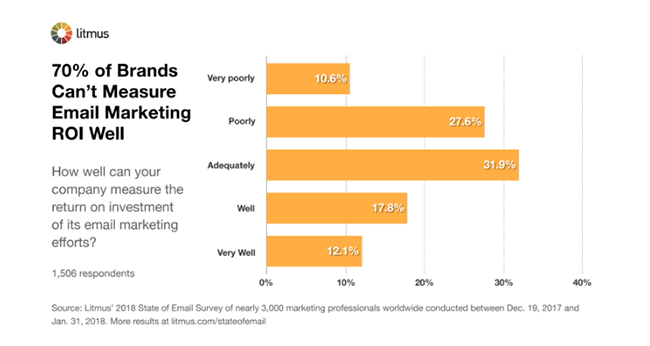
Brands still struggle to effectively measure email ROI
Only around 30% of brands think they are able to measure their email marketing ROIs well. Around 32% can measure it adequately, and around 38% poorly or very poorly. This may be because most brands haven’t yet developed and executed sophisticated email marketing programs, or a sign that brands don’t consider measuring email ROIs to be a top priority due to the well-known high-ROIs. (Litmus)
The most sophisticated email marketing programs generate lower ROIs
Counter-intuitively, making your email marketing programs more sophisticated may actually lower your immediate ROIs. Unsophisticated programs generate ROIs of 44:1 compared to sophisticated program ROIs of just 38:1. This may be because more sophisticated programs shift their focus from immediate return rates to overall returns. (Litmus)
Email open rate stats
The open rate is the percentage of email recipients that open your emails; it’s an important metric when it comes to evaluating the performance of your email marketing campaigns. Here are a few open rate statistics you might find interesting.
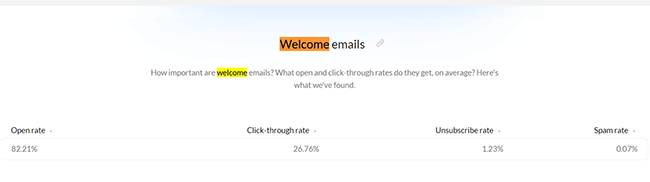
Welcome emails have the highest open rates
Average welcome email open rates stand at a whopping 82% because customers are expecting them, and looking out for them to land in their inbox. Make sure you’re taking advantage of that high open-rate. (GetResponse)
Personalizing your subject lines boosts open rates by 50%
This shows just how important personalization is to email marketing. However, statistics also show that it’s still underutilized. Only 2% of marketing emails use personalization. (Yes Lifecycle Marketing)
For further reading, be sure to check out our roundup of personalization statistics.
Emails with emojis in the subject line generate higher open rates
Try throwing in an emoji in your subject lines and you might just see higher open rates. One recent study showed emojis led to higher open rates 56% of the time. (Experian)
Email spam rate stats
Spam rates are important too – nobody wants their valuable marketing communications end up lost in their customer’s spam box. Below are some email spam rate stats that you might find useful.
45% of all emails are considered spam
A whopping 14.5 billion spam emails are sent every single day, so it’s no wonder consumers are wary of them. Make sure you’re not part of the problem and only send promotional messages your customers want to hear. (Blogging Wizard)
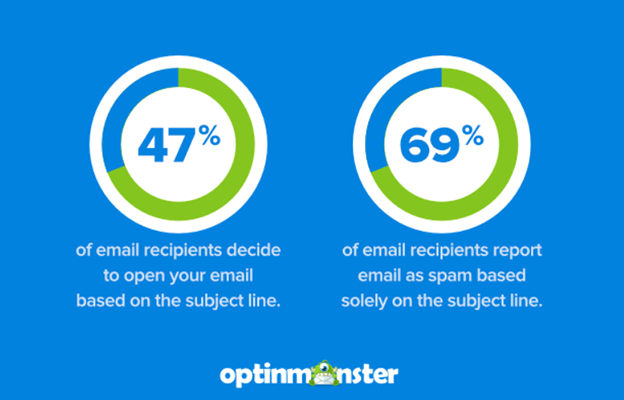
69% of email recipients mark emails as spam based on the subject line
This is why subject lines are so important, not just for your open rates, but for deliverability too. (OptinMonster)
43% of email recipients mark emails as spam based on the sender’s email address
Yep, email addresses are important too. This shouldn’t be a problem if you’re using a legitimate business email address. (Vivipins)
Email segmentation statistics
Segmentation – the act of ‘segmenting’ your email list up based on customer data – is one of the most important and powerful new trends in email marketing. Here are some email segmentation statistics worth knowing about.
33% of brands use email marketing segmentation
That was based on a report from back in 2008. By now, I’d expect that figure to be much higher, considering how powerful segmentation is and how increasingly easy it is to implement. (Demand Gen Report)
Segmenting your email campaigns leads to 100% higher CTR
And this is exactly why running segmented email campaigns is a no-brainer. The more targeted your emails are to your audience segments, the better your campaign performance. (MailChimp)
Email personalization generates 6x greater transaction rates
Personalizing your emails to different audience segments leads to 6x transaction rates. That’s 600% more revenue in your pocket. (Experian)
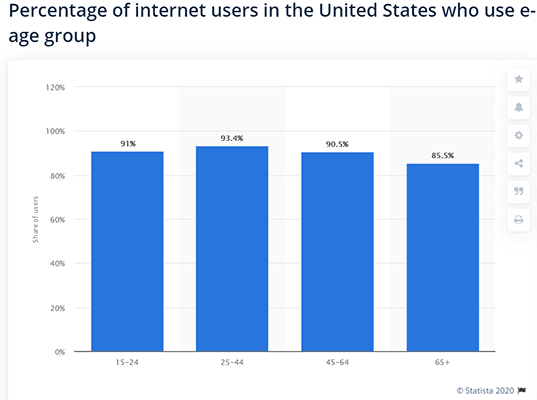
More 25-44-year-olds use email than any other age group
93.4% of those aged 25 to 44 in the US use email, around 8% more than those over 65. (Statista)
Women spend longer checking emails than men
I’m not sure how useful that statistic is, but perhaps you’ll be able to use it to inform the way you segment your campaigns. (UKOM & Comscore data)
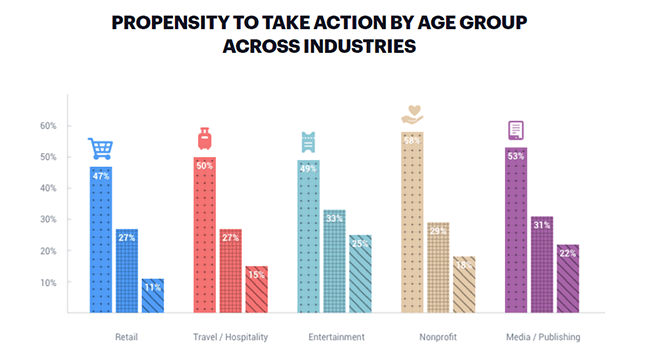
Millennials are the most likely age group to take action on relevant emails
Far more likely. As an example, 58% of millennials will always or usually donate to a nonprofit due to an email, compared to just 18% of those aged 55+. This has clear implications for your email segmentation efforts. (Campaign Monitor)
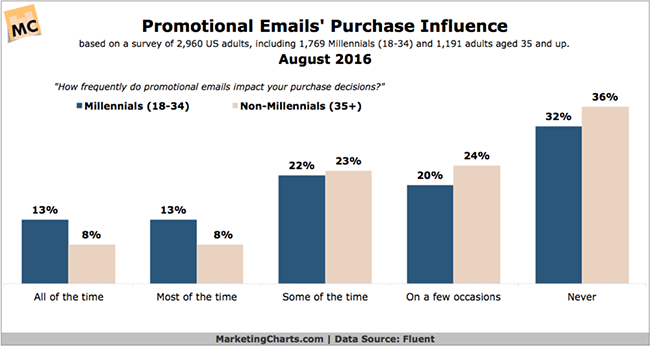
Millennials are more likely to agree that marketing emails influence their purchase decisions than non-millennials
63% more likely, to be exact. Again, this shows how important email marketing is to the millennial market. (Marketing Charts)
Mobile email statistics
Before we wrap up, here are some email marketing statistics that relate to mobile use.
62.13% of people will ignore or delete an email that doesn’t look or work as expected on mobile
The same study of 1,424 adults revealed that 20.87% would try their best to read the email and 17% would look at it later on their desktop/laptop. (Dyspatch)
49% of emails are opened on mobile
If you’re not optimizing your email messages for mobile users, you’re not optimizing your emails for almost half your list. (IBM)
81% of people check emails on smartphones compared to just 21% on tablets
Of all those mobile users, around four-fifths open emails up on their smartphones. Again, this shows how important it is to optimize your emails for small screens. (Adobe)
People in the UK are most likely to read emails on their mobile compared to other countries
If your customers are primarily from the UK, it’s even more important to focus on mobile. 62.9% of UK consumers read emails on their mobile phones. (IBM)
Older generations are much less likely to read an email on their mobile first
55% of 56 to 67-year-olds say they aren’t likely to read emails on their mobile first, whereas just 18% of 19 to 34-year-olds say the same. (Adestra)
Final thoughts
There you have it – 40+ email marketing statistics to inform your email marketing strategy. As you can see, email’s not going anywhere soon, but it is changing.
If marketers want to continue to reap the benefits of email marketing and unlock those juicy ROIs, they need to focus on effective segmentation and personalization and make sure they’re optimizing their email content for mobile.
Hopefully, these statistics have given you some valuable insight that you can use to build on and improve your existing email marketing efforts.
Want more data and statistics? Be sure to check out our articles on:
- Marketing automation stats
- Lead generation stats
- Landing page statistics
- Conversion rate optimization stats
- SMS marketing trends
- Chatbot statistics
- Digital marketing stats
Finally, if you need help choosing software to help you, check out our comparison of the leading email marketing providers.